Tooling
Graph Visualizer
An interactive tool for watching graph traversal and pathfinding algorithms run, step by step.
- Python
- Algorithms
- Visualization
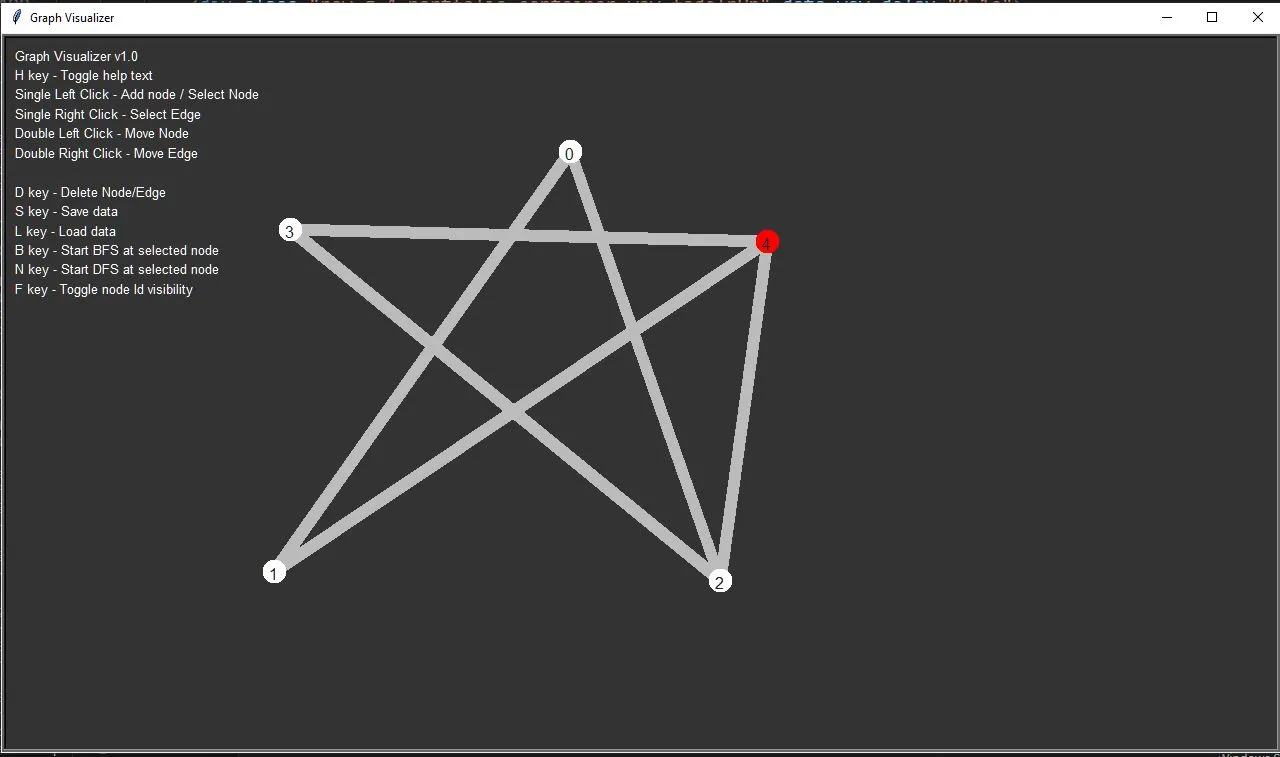
Graph algorithms are much easier to reason about when you can see them move. This tool renders a graph and animates traversal and pathfinding algorithms across it one step at a time, so the frontier, the visited set and the resulting path are all visible as they develop.
Why build it
Reading BFS and DFS pseudocode tells you what happens. It does not give you an intuition for why Dijkstra’s expanding wavefront looks the way it does, or how differently A* behaves once a heuristic is guiding it. Watching the frontier grow does.
How it works
The core is a small stepper: each algorithm is written as a generator that yields its state after every meaningful operation, and the renderer draws whatever the current state is. Separating the algorithm from the drawing meant adding a new algorithm required no rendering code at all, just another generator.
Speed control, pause and step-forward all fall out of that design for free, since the UI is simply deciding how fast to pull from the generator.